Know Your Engine: Introducing Runner Phenotype Classification & Metabolic Visualizations
Stop training like everyone else. Your body burns fuel differently.
We've just launched two game-changing features that reveal exactly how YOUR metabolism works—not some theoretical "average runner," but you, based on your actual performance data.
The Problem: Cookie-Cutter Training Plans
You've seen it before: "Do 3x8min threshold, rest on Sundays, fuel every 45 minutes."
But here's the truth: A sprinter-type runner and a diesel-type runner need completely different training. One needs more aerobic base work, the other needs speed development. One burns through carbs at threshold, the other is fat-burning efficient.
Generic plans ignore these differences. We're fixing that.
Feature 1: Runner Phenotype Classification
What It Is
After you complete our 3/6/12-minute time trial protocol, we analyze your pace drop patterns to classify you into one of three metabolic phenotypes:
🔥 Sprinter (High Glycolytic)
- Big pace drop from 3→6 minutes, holds well 6→12 minutes
- Strong anaerobic power, moderate aerobic endurance
- What you need: More Zone 2 work to build aerobic efficiency
🔋 Diesel (High Aerobic)
- Small drop 3→6 minutes, bigger drop 6→12 minutes
- Excellent fat-burning efficiency, limited top-end speed
- What you need: High-intensity intervals and neuromuscular work
⚖️ Balanced (Well-Rounded)
- Moderate drops across both intervals
- Versatile metabolic profile
- What you need: Standard progressive periodization works great
Why It Matters
If you're a Sprinter trying to run a marathon on feel-good Zone 2 miles, you'll hit the wall at mile 20. Your aerobic engine isn't built yet.
If you're a Diesel hammering VO₂max intervals every week, you're polishing an already-efficient aerobic system while ignoring your speed ceiling.
This classification tells you WHERE to focus your training energy for maximum return on investment.
Feature 2: Professional Metabolic Visualizations
We don't just tell you your phenotype—we show you how your metabolism works with professional-grade visualizations used by elite sport scientists.
Visualization 1: Metabolic Capacity Split (Donut Chart)
See your aerobic vs. glycolytic capacity breakdown at a glance:
- Sprinters: 55% Glycolytic Battery / 45% Aerobic Engine
- Diesels: 65% Aerobic Engine / 35% Glycolytic Battery
- Balanced: 50/50 split
This isn't just aesthetics—it's a visual representation of your power duration curve and fatigue resistance patterns.
Visualization 2: Substrate Utilization Curve (Line Chart)
This is the game-changer for race fueling strategy.
You'll see exactly how many grams per hour of fat vs. carbs you're burning at each training intensity:
- Recovery (60% CS): Mostly fat, minimal carbs
- Easy/Zone 2 (70% CS): Balanced fat/carb mix
- Tempo (80% CS): Carbs starting to dominate
- Threshold/CS (90-100% CS): Heavy carb reliance
- VO₂max (110-120% CS): Almost pure glycolytic
- Anaerobic (130% CS): Maximal carb burn
For Sprinters: Your carb line ramps up early and steep. You NEED to fuel more frequently in marathons—every 30-40 minutes, not 45+.
For Diesels: Your fat oxidation stays high even at tempo pace. You can go 45-60 minutes between gels without bonking. This is your superpower for ultras.
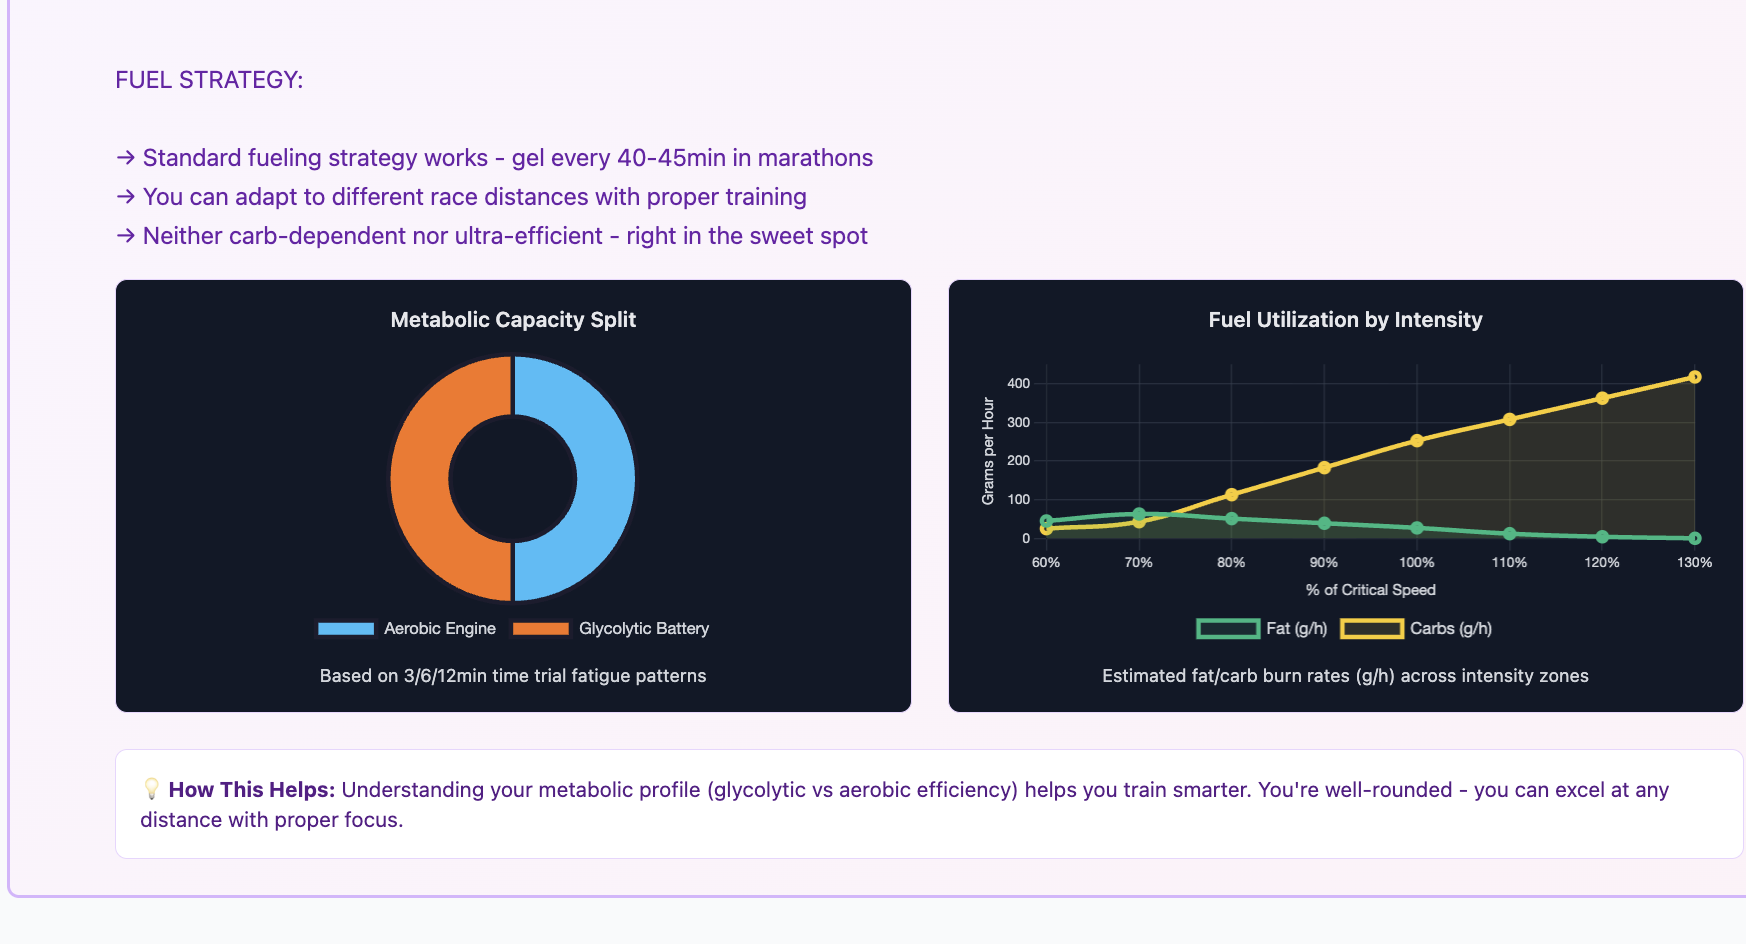 Example metabolic visualizations showing capacity split and substrate utilization for a Balanced runner profile.
Practical Application: Training & Fueling
Let's say you're a Sprinter training for a marathon:
What the Donut Chart Shows You:
Your glycolytic battery is strong (55%), but your aerobic engine is underdeveloped (45%). You have the speed—you need endurance.
What the Substrate Chart Shows You:
At threshold pace (90% CS), you're burning ~250g/h of carbs. Compare that to a Diesel burning ~180g/h at the same relative intensity.
Your Training Focus:
- Add 2-3 weekly Zone 2 sessions (build that aerobic engine)
- Include tempo runs to improve lactate clearance
- Maintain speed with 1x weekly intervals (don't lose your edge)
Your Race Fueling Strategy:
- Fuel every 30-40min in marathons (you burn carbs faster)
- Practice fat oxidation in Zone 2 long runs
- Don't rely on your speed early—pace conservatively
How to Access These Features
- Complete the Assessment: TEST → Assessment → Enter your 3/6/12-minute time trial distances
- View Your Dashboard: You'll see your phenotype card with both visualizations
- Get Personalized Guidance: Training focus, fuel strategy, and goal alignment recommendations
The Science Behind It
This isn't guesswork. Our classification system is based on validated Margaria-Morton digital twin physiological modeling—the same principles used by elite sport scientists to profile Olympic athletes.
Your pace drop patterns reveal: - Glycolytic capacity (anaerobic battery size) - Aerobic efficiency (fat oxidation ceiling) - Lactate clearance ability - Metabolic crossover points
We've simply made this level of insight accessible to everyday runners.
Stop Training Blind
You wouldn't drive across the country without checking your fuel gauge. Why would you train for a marathon without knowing how your metabolism works?
Try it now: Run our 3/6/12-minute protocol and discover your metabolic phenotype. Your dashboard is waiting.
Ready to see your metabolic profile? Head to the Assessment page and unlock your personalized training insights today.